Density Contour Diagram
Purpose: Learn to calculate density contour diagram. In this example, the density contour lines will be plotted in the Al-Mg binary phase diagram so that density at different temperatures and compositions can be viewed together with phase stability.
Module: PanPhaseDiagram
Thermodynamic and molar volume Database AlMg_MV.tdb
Batch file: Example_#1.14.pbfx
Calculation Procedures:
-
Load AlMg_MV.tdb following the procedure in Pandat User's Guide: Load Database , and select Al and Mg two components;
-
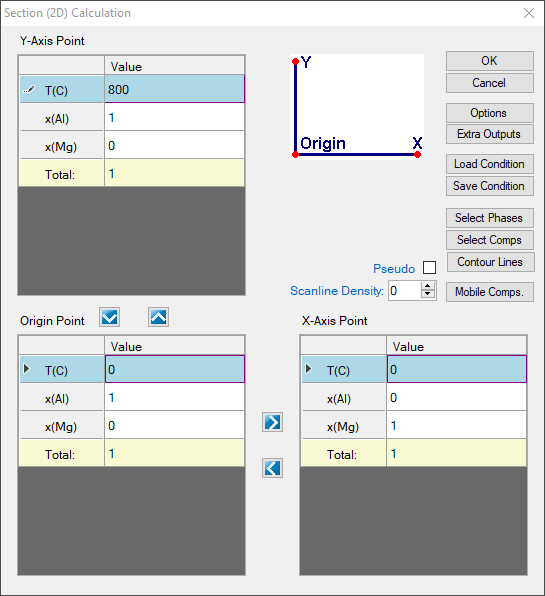
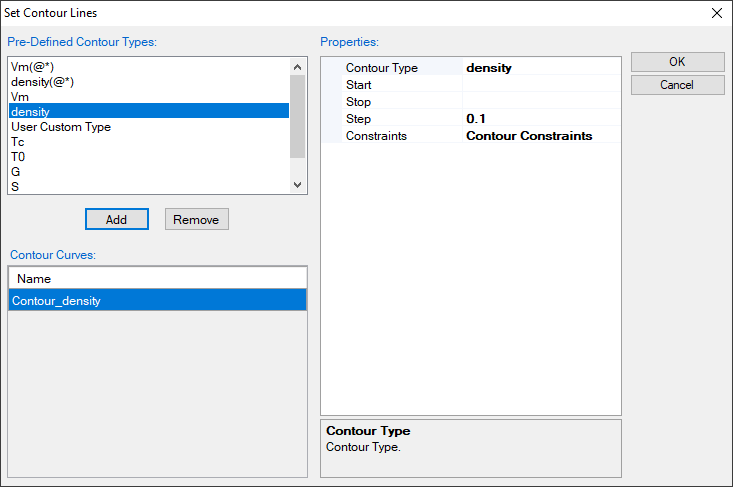
First set up the calculation condition as shown in Figure 1 in the same way as we did to calculate Al-Mg binary phase diagram (see Al-Mg Binary Phase Diagram), then click “Contour Lines” to open the contour line dialog as shown in Figure 2;
-
Choose “Density” and click Add. the contour type of density will be added as shown in Figure 2, then press OK;
Post Calculation Operation:
-
Change graph appearance following the procedure in Pandat User's Guide: Property;
-
Label each line by putting the cursor on each line and wait for the tool tip to pop out, then press F2;
Information obtained from this calculation:
-
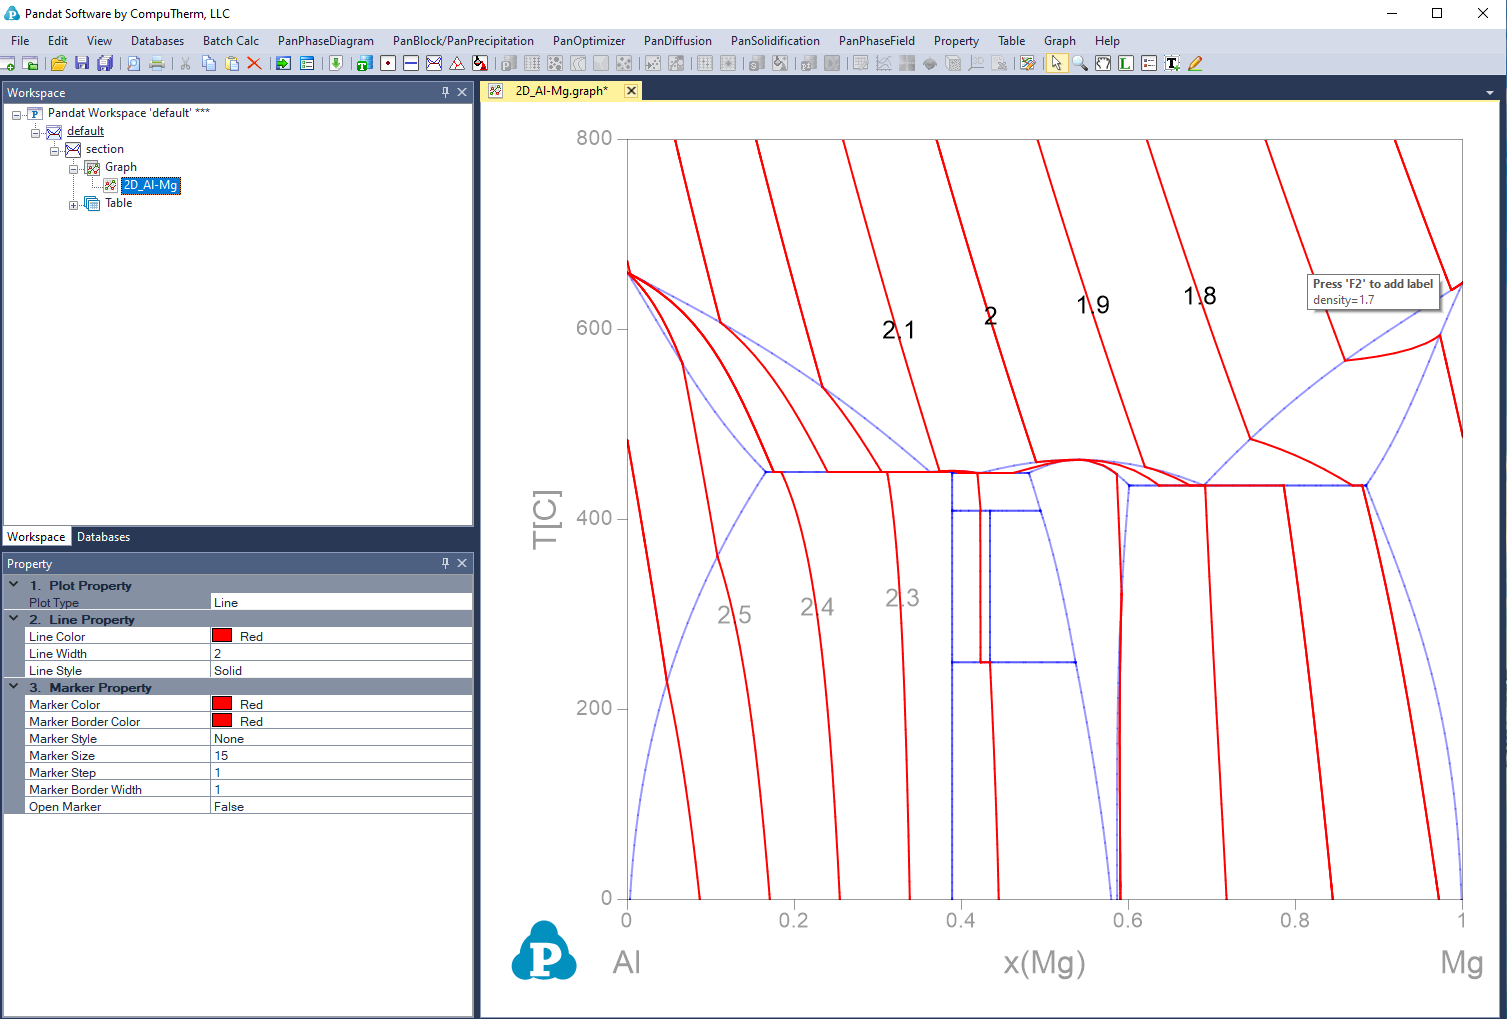
Figure 3 shows the density contour diagram, i.e., plotting density contour lines on top of the Al-Mg binary phase diagram. The density on the same red line is constant;
-
Density contour diagram is very useful in alloy design. Given the requirements on stable phases and alloy density, the alloy compositions can be identified from this one diagram;